
Explainable AI in Pricing: Turning Black Box Model into Trusted Decisions
Authored by Sunil Yoon, Principal Actuarial Consultant, RNA Analytics
1. Introduction
As the field of Data Science continues to develop rapidly, many companies are showing increasing interest in modeling using Machine Learning or Deep Learning and are applying these technologies in their actual business operations. These technologies have the advantage of providing high predictive performance, but in many cases, it is difficult to clearly explain how the model derives its results. These models are commonly referred to as Black Box Models.
In practice, even actuaries may find it difficult to intuitively explain the complex model structure and internal calculation process. As a result, there may be limitations in using AI-based modeling results externally or reflecting them in decision-making.
Recently, efforts to use XAI (Explainable Artificial Intelligence) have been expanding to address these practical limitations. XAI is a methodology that helps users interpret AI model results more easily and understand which variables and patterns the model uses to make its decisions. In this article, we introduce the main methodologies of XAI and discuss how they can be used in insurance pricing and modeling practice.
2. Various Methodologies of XAI
According to the “Artificial Intelligence Governance Framework” paper published by the IAA AI Task Force in November 2025, XAI methodologies can be broadly divided into Local Metrics and Global Metrics. Each has the following characteristics.
Local Metrics focus on explaining how each input variable affects an individual prediction. Representative methodologies include Individual Conditional Expectation (ICE), Local Interpretable Model-agnostic Explanations (LIME), and Shapley Additive Explanations (SHAP). These methodologies show the direction and magnitude of the impact that each variable has on the final prediction for a specific observation or contract. The following is an example of SHAP results.
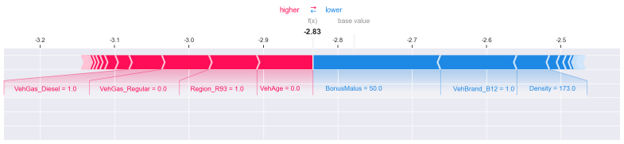
Through SHAP results, we can identify how much each variable contributes to the final model output for a specific observation. For example, if the final model output is calculated as -2.83, and the value of the input variable BonusMalus is 50, this variable can be interpreted as contributing to lowering the final output by approximately 0.15 compared to the base prediction value. In this way, we can identify the direction and magnitude of the impact of each input variable on an individual prediction, and more intuitively understand the rationale behind the model’s decision for a specific contract or data point.
Global Metrics, on the other hand, do not focus on individual predictions, but evaluate how each variable affects the prediction results from the perspective of the overall model. Representative methodologies include Partial Dependence Plot, Feature Importance Stability, and Fairness Metric. When a model is built using multiple variables, Global Metrics are useful for understanding which variables have relatively greater influence across the overall model. The following is an example visualization of Feature Importance results generated in R3S GIP.
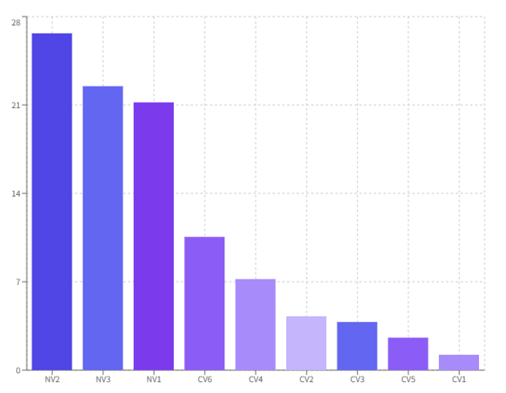
These results are SHAP-based Feature Importance results, showing the relative influence of each variable on the model output. If the total importance is normalized to 100 and the value of the variable NV2 is approximately 26, this can be interpreted to mean that NV2 has a relatively large influence in the process of generating predictions in the model. However, it should be noted that this value does not represent a direct causal contribution to actual loss ratios or claims, but rather a relative importance based on the model output.
Variables with low importance can be used as a starting point for reviewing candidate variable removal or model simplification. However, the actual removal of variables should be determined after checking model performance, stability, and business validity through retraining. Through this process, it can help review the construction of a lighter and more interpretable model while checking the predictive performance of the model.
3. Considerations and Alternatives
By using XAI techniques, a certain level of explainability can be secured for AI-based models. However, these methodologies alone cannot explain everything, and there are several important limitations.
For example, Feature Importance can show how much a variable contributes to the model’s prediction results or output. However, this does not necessarily mean that there is a direct correlation or causal relationship between the variable and the actual result. In addition, when correlations exist between variables, the importance of a specific variable may be overestimated or underestimated.
Similarly, Feature Importance alone cannot clearly explain how much the final output changes when a specific variable increases by one unit, or what that change means from an actual business perspective. Therefore, XAI results should be used as reference materials for understanding the model, and caution is needed when interpreting them as complete explanations or causal evidence.
One way to complement these limitations is to consider the Surrogate GLM Model approach. A Surrogate GLM Model is a method that learns the prediction results of complex AI models, such as Neural Networks or Gradient Boosting Models, and creates a GLM model that approximately explains those results. Specifically, the ML model first generates predictions for the dataset being analyzed, and then a GLM model is built by setting these predictions as the target values and fitting a model that produces the most similar results.
GLM has the advantage of being relatively intuitive in structure and allowing users to identify the relationship between the prediction values being explained and the input variables, as well as the coefficients and direction of impact for each variable. Therefore, using a Surrogate GLM can help supplement the explainability of AI-based pricing results in a more understandable way.
However, a Surrogate GLM is not a model that directly explains the original ML model itself, but rather an auxiliary model that approximately reproduces the prediction results of the existing model. Therefore, it is appropriate to use it for auxiliary interpretive purposes to understand the overall patterns and direction of variable impacts in the AI model, rather than as a replacement for the actual pricing model.
4. Conclusion
The efforts of actuaries to enhance modeling through the use of AI technology have continued to develop since Machine Learning became widely used. Recently, with the development of various AI technologies, including LLMs, access to ML/DL-based modeling, which was previously considered a specialized area for Data Scientists, has gradually become easier. As a result, the applicability of AI-based modeling in insurance practice is expanding.
Actuaries have deep domain knowledge gained through various working experience. When this domain knowledge is combined with AI-based modeling technology, it is expected that more sophisticated and practically useful pricing and modeling frameworks can be developed.
Explainable AI presents the modeling results produced by actuaries using AI in a more interpretable form and helps them be used together with traditional explanation frameworks. Through this, it can increase the reliability of AI-based modeling results and help them be reflected more smoothly in actual company decision-making processes.
RNA, as a global actuarial software company, has various related product lines and plans to continue developing related features and solutions together with its clients.