Unlocking Efficiency: Optimizing Models with R3S Modeler Profiler
Authored by Manuel Montes Senior Actuarial Consultant, RNA Analytics
Did you know that with the Profiler functionality in R3S Modeler, you can precisely identify which components and variables consume the most time during your model's execution?
In actuarial environments where a Solvency II closing or an ALM calculation can take hours understanding exactly what consumes your execution time is no longer just a technical curiosity; it is a direct driver of productivity. Without this level of visibility, optimizing a model is little more than trial and error.
How Profiler Works
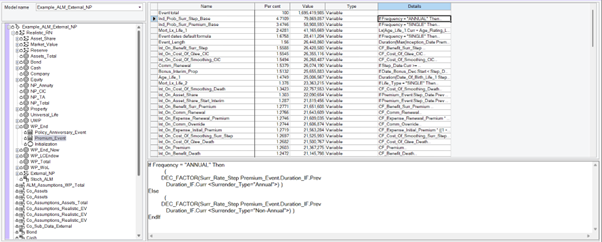
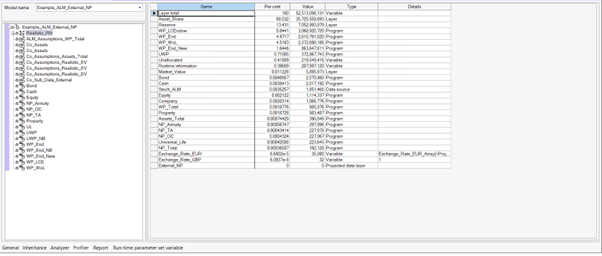
One of the most powerful, and often underutilized, capabilities of R3S Modeler is the Profiler functionality. When you run an execution using the "Profile" type, you receive a complete breakdown of your model's computational cost across three distinct panels:
The Component Tree: View your model's hierarchy.
The Data Grid: A view displaying the percentage and absolute value consumed by each element, alongside its type.
The Formula Panel: Allows you to drill down to the specific expression used in the calculation.
With just a few clicks, you can identify real bottlenecks instead of relying on intuition—whether those bottlenecks are variables, subcomponents, or even the time taken to read a data source.
The Impact on Your Workflow
For actuarial and IT teams working with tight closing windows, leveraging this tool translates into several key benefits:
Shorter execution cycles.
More efficient models.
Complete traceability of each component's performance.
Ready to Optimize?
Profiler is an optional feature within R3S Modeler. If you would like to check if your license includes it, or if you want to learn more about how it can help you improve the efficiency of your models, please contact your account manager, and we will organize a tailored session for your team.